如何畫圖
圓形是畫圖之重要項目之一,但是在MATLAB並無直接指令可進行畫圓。畫一個圓需要圓心及半徑,亦需要顏色的參數。問題是圓在繪製時,必須先清礎座標的比例,否則會造成楕圓或比例不對稱的圓,此點可以在畫圓前先作等軸的宣告,至於終端機本身之軸向若有不等比例,則必須由終端機之控制鈕調整。即:
>> axis equal;
或
>>axis image
後者之指令功能與前者大略相同,但它會將所繪的圖自動調整至中央部份,可以一覽全圖。無論如何,經由上述任一個宣告之後,兩軸之比例亦會相等,若不宣告,則必須自行調整視窗之長與寬,使其近似等比的情況。
基本上圓周之構成可用三角函數的關係式計算:
x=rcosθ
y=rsinθ 1.1
其中角度θ則應自零至360度。而其區間應為θ/ Nb。
繪圓之指令(circle.m)則如下述,其輸入參數包括半徑、圓心位置及繪製之點數。本指令本身並不自行繪圖,主要提供圓周各點之座標,供其他座標操作用途,故必須配合一小程式執行繪圖之功能:
function [coords] = circle(r,x0,y0,nn)
% This function draws a circle in a radius r,
%    at the center (x0,y0)
% The inputs:
%   r    = radius of circle
%  x0, y0= coordinates of the circular center
%  nn    = number of drawing points
%  coords(nn,1-2)= vectors to store the coordinates
%  Example: circle(10,0,0,10)
jj=0:2*pi/nn:2*pi;
coords=[x0+r*cos(jj);y0+r*sin(jj)];
%%%%%%%%%%%%%%%%%%%%%%%%%%%%%%%%
實例:繪一半徑為5,原點處之圓。
>> coord=circle(5,0,0,20)
coord =
Columns 1 through 8
 5.0000  4.7553  4.0451  2.9389  1.5451 0.0000 -1.5451 -2.9389
      0  1.5451  2.9389  4.0451  4.7553 5.0000  4.7553  4.0451
Columns 9 through 16
-4.0451 -4.7553 -5.0000 -4.7553 -4.0451-2.9389 -1.5451 -0.0000
 2.9389  1.5451  0.0000 -1.5451 -2.9389-4.0451 -4.7553 -5.0000
Columns 17 through 21
 1.5451  2.9389  4.0451   4.7553   5.0000
-4.7553 -4.0451 -2.9389  -1.5451  -0.0000
>> plot(coord(1,:),coord(2,:))
>> axis equal
>> grid on
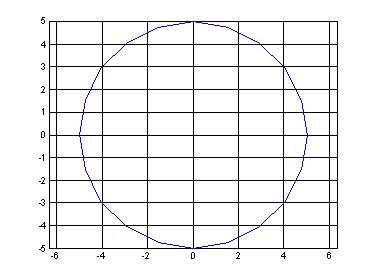 圖1.半徑為5圓心為原點之圓
上述指令中,plot()是常用的指令,但也可以用line()這個指令取代(讀者可以自行在MATLAB上測試)。兩個間之不同處是,可以同時繪多圖,亦可在其後面之參數添加顏色值,後則是僅能繪一組線資料,其顏色則必須利用set()之指令進行設定。一般認知上,應為圓滑之曲線,但就circle()指令之操作,實際上圓仍由線段組成。因此段數或點數nn愈多,所繪製之曲線會愈為平滑;而其平滑度仍然會與半徑大小有關。故nn值之設定在本例中也有其重要性。
上述circle()之繪圓指令,只是先獲得圓周點之資料,供其他程式計算之用途。指令若能直接繪圖,則其功能將更為強大。函數circle1()是另一種多功能的繪圓指令,其內容如下:
function h=circle1(r,x0,y0,Nb,C)
% function h=circle1(r,x0,y0,Nb,C)
% Adding circles to the current plot
% Variables:
%    r:radi of circle, a scalar or row matrix.
%    x0,y0: Centers of circles, a scalar or row matrix
%    C:line colors, a string ('r','b'...),
%           or RGB values in column
%    Nb:No. of drawing points, a scalar or
%           row matrix(default=300)
%           the size of Nb must be one
%           or equal to the size of r.
%    h:handles to the circles
% Rules:
%  1. r=a matrix, (x0,y0)=a scalar:Multiple
%     co-centered circles
%  2. r=a scalar, (x0,y0)=row matrix: circle with
%     r at each center
%  3. r,(x0,y0)=same length row matrix: circle
%     with coresponding r at cooresponding center
%  4. r,(x0,y0)=different-length row matrix: Mutiple
%         circles with different r at each center.
% Examples: (execute the commands "clf;" first)
%% Example 0:> circle1
%% Example 1
%  circle1([1 2 3],[2 3 5],[1 2 1],20);
%
%% Example 2
% the=linspace(0,pi,200);
% r=cos(5*the);
% circle1(0.1,r.*sin(the),r.*cos(the),20,hsv(40));
%
%% Example 3
% [x,y]=meshgrid(1:10,1:10);
% circle1([0.5,0.3,0.1],x,y,20,['r';'y']);
%
%% Example 4
% circle1(1:10,0,0,3:12,[]);
%
%% Example 5
% circle1((1:10),[0,0,20,20],[0,20,20,0]);
%
% rewritten by Din-sue Fon. BIME, NTU. Date:Nov 18,2004.
% Check the number of input arguments
axis equal;
if nargin <5,C=get(gca,'colororder');end
if nargin <4,Nb=300;end
if nargin <3,y0=0;end
if nargin <2,x0=0;end
if nargin <1,r=1;end
% Change matrices into row-wise ones
x0=x0(:);y0=y0(:);r=r(:);Nb=Nb(:);nx=length(x0);
if length(y0)>nx&nx==1,x0=ones(length(y0),1)*x0;end;
if nx>length(y0)&length(y0)==1,y0=ones(nx,1)*y0;end;
nr=length(r);nx=length(x0);nnb=length(Nb);

if length(y0)~=nx,
error('The lengths of x0 and y0 must be identical');
return;
end;
% plotting
for k=1:nx,
 if nx==nr,
    coords=circle(r(k),x0(k),y0(k),Nb(rem(k-1,nnb)+1)+1);
    h(k)=line(coords(1,:),coords(2,:));
    set(h(k),'color',C(rem(k-1,size(C,1))+1,:));
 else
     for m=1:nr
         coords=circle(r(m),x0(k),y0(k),...
            Nb(rem(m-1,nnb)+1)+1);
         h(k,m)=line(coords(1,:),coords(2,:));
         set(h(k,m),'color',C(rem(k*m-1,size(C,1))+1,:));
     end
 end
end

%%%%%%%%%%%%%%%%%%%%%%%%%%%%%%%%%%%%%%%%%

function [coords] = circle(r,x0,y0,nn)
% function [coords] = circle(r,x0,y0,nn)
% This function draws a circle in a radius r,
%    at the center (x0,y0)
% The inputs:
%   r    = radius of circle
%  x0, y0= coordinates of the circular center
%  nn    = number of drawing points
%  coords(nn,1-2)= vectors to store the coordinates
%  Example: circle(10,0,0,10)
jj=0:2*pi/nn:2*pi;
coords=[x0+r*cos(jj);y0+r*sin(jj)];
%%%%%%%%%%%%%%%%%%%%%%%%%%%%%%%%%%%%%%%%%%
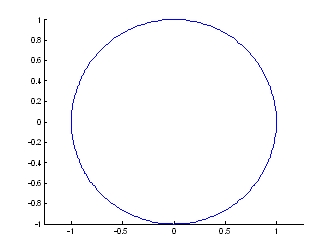 圖2.半徑為預設值1圖心為原點之圓
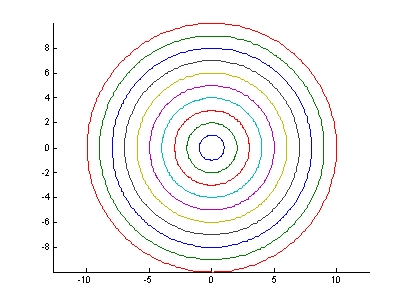 圖3.同心圓
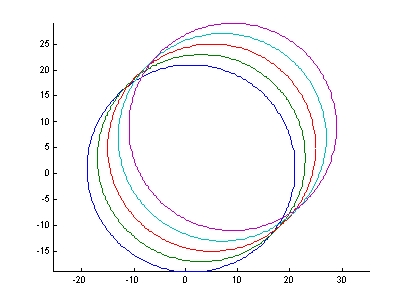 圖4.同心圓不同圓心位置
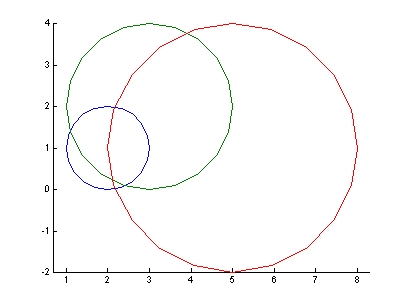 圖5.不同半徑及圖心下之各圓
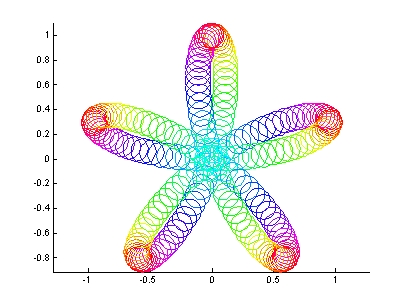 圖6.固定半徑但變化圖心位置下之各圓
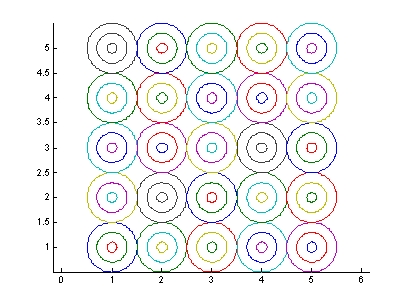 圖7.利用網格製作同心圓
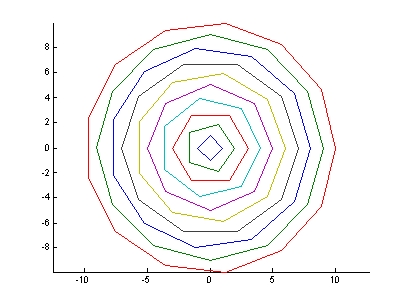 圖8.利用圓周之點數繪製不同之正多邊形
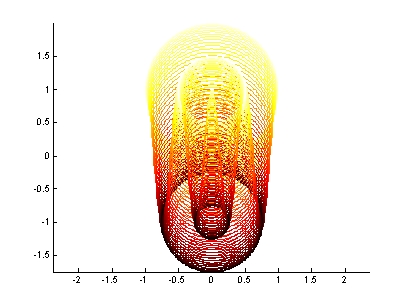 圖9.變化半徑及垂直圓心座標之情形
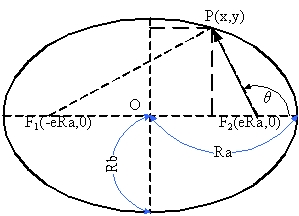 圖10.橢園曲線之形成
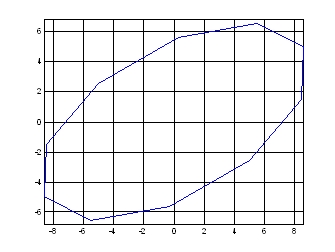 圖11.橢圓曲線之形成
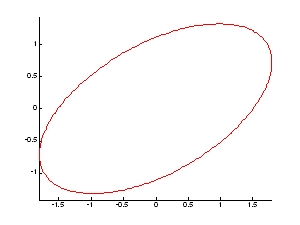 圖12 具有傾斜角度之ellipse 圓
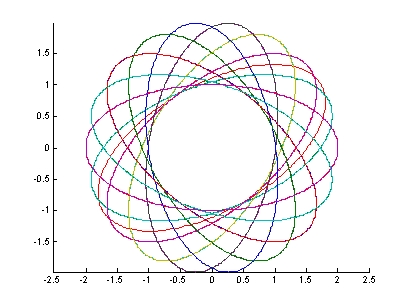 圖13.橢圓產生不同角度旋轉時之變化
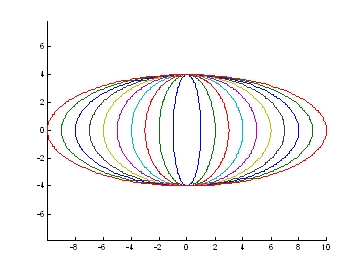 圖14.短徑不變,橢圓產生不同長徑時之變化
 圖15.橢圓長短徑同時變化
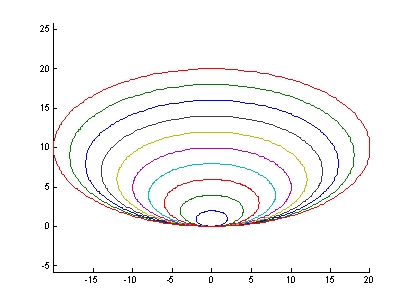 圖16.橢圓產生不同長徑時之變化
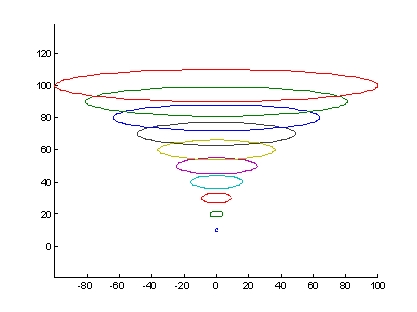 圖17.橢圓產生不同長徑時之變化